.png)


Key Takeaways
- Strong marketing starts with understanding where guests come from and how that changes over time.
- Geographic and booking source data help marketers prioritize budgets based on booking behavior rather than assumptions.
- Looking beyond clicks and impressions provides a clearer picture of whether marketing efforts are influencing demand.
Every marketing team is trying to answer the same question: where should we invest next?
That’s not always an easy decision. A campaign may generate plenty of traffic without producing bookings. A market that performed well last year may have slowed, while another has quietly become a growing source of demand. Even channel performance shifts over time as travelers change how they discover and book vacation rentals.
Marketing data is most valuable when it explains those shifts. The reports below don’t replace campaign metrics like clicks or conversions, but they do add an important layer of context. They show where guests originate, how those markets are evolving, and whether your marketing strategy aligns with actual booking behavior.
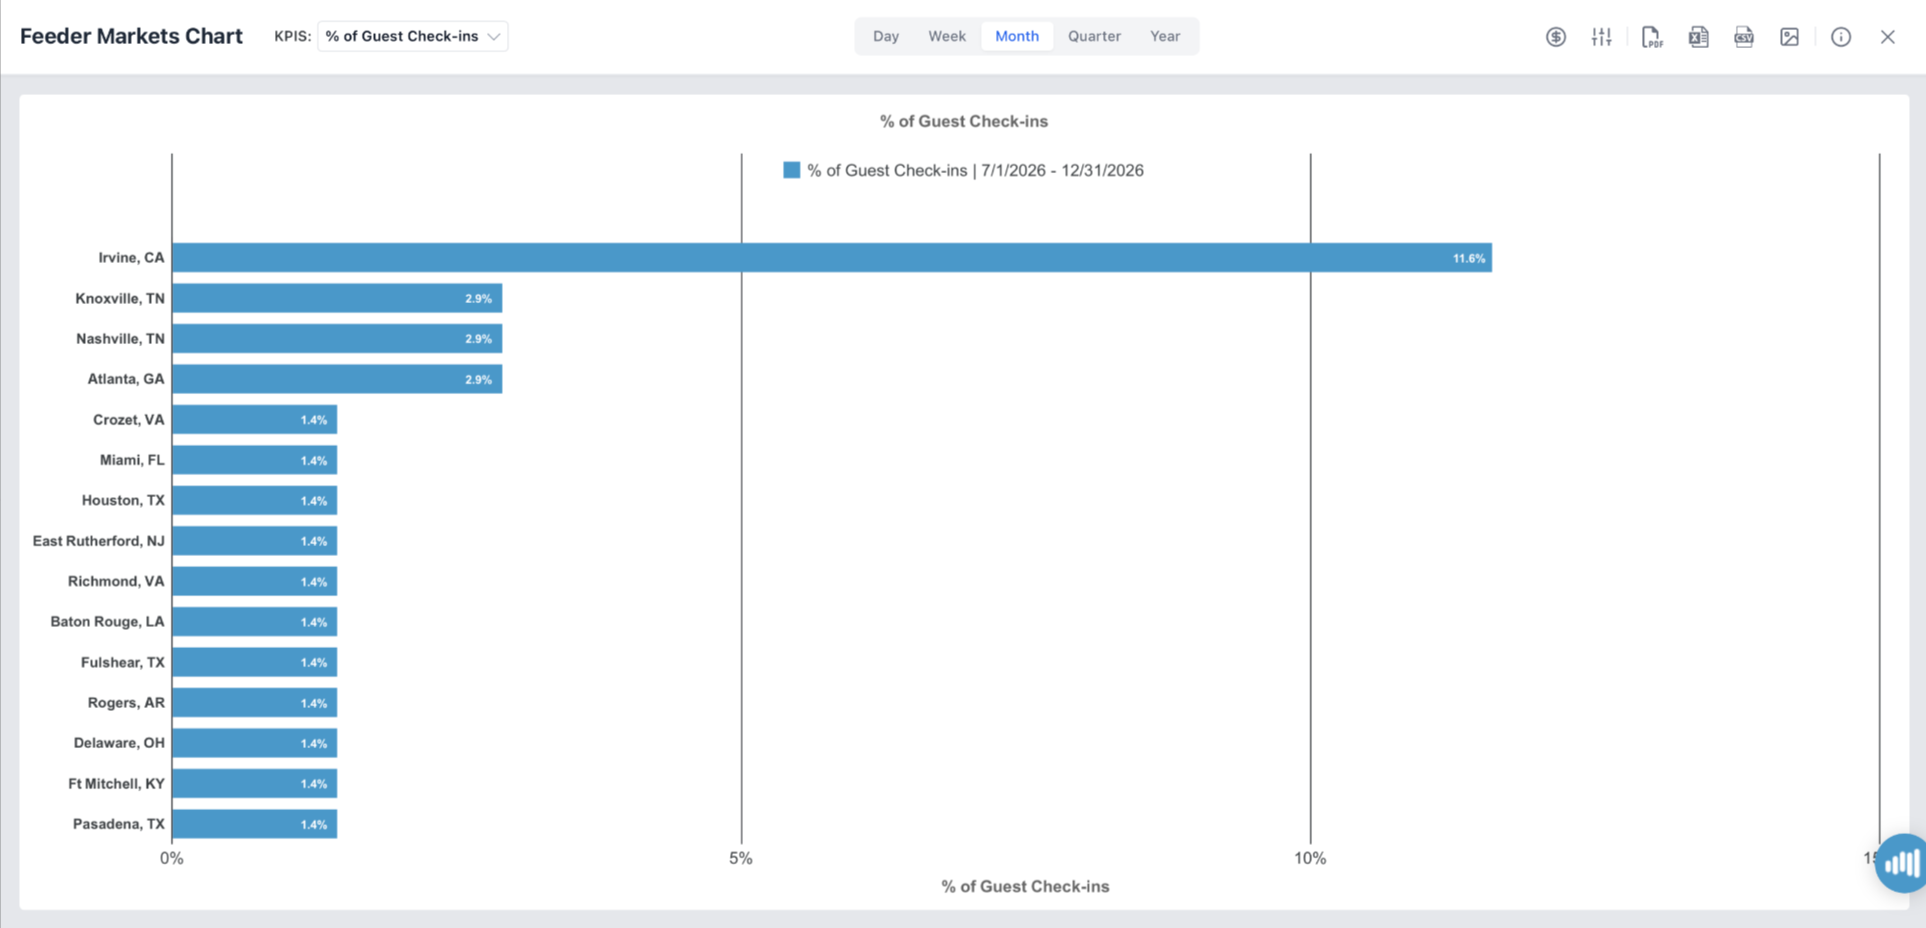
Feeder Markets Chart: Watch Demand Move Over Time
Guest origin isn’t static. New markets emerge, established markets fluctuate, and regional demand shifts throughout the year. Those changes often happen gradually, making them difficult to spot when looking at a single month’s performance.
The Feeder Markets Chart tracks guest origin over time, making long-term trends much easier to identify.
That historical view is useful when evaluating marketing initiatives. If a campaign targets a specific region, this report helps determine whether that market is becoming a larger share of your business or whether demand has remained unchanged.
Not every change can be attributed to marketing, but understanding how your feeder markets evolve makes it easier to separate seasonal variation from meaningful shifts in demand.
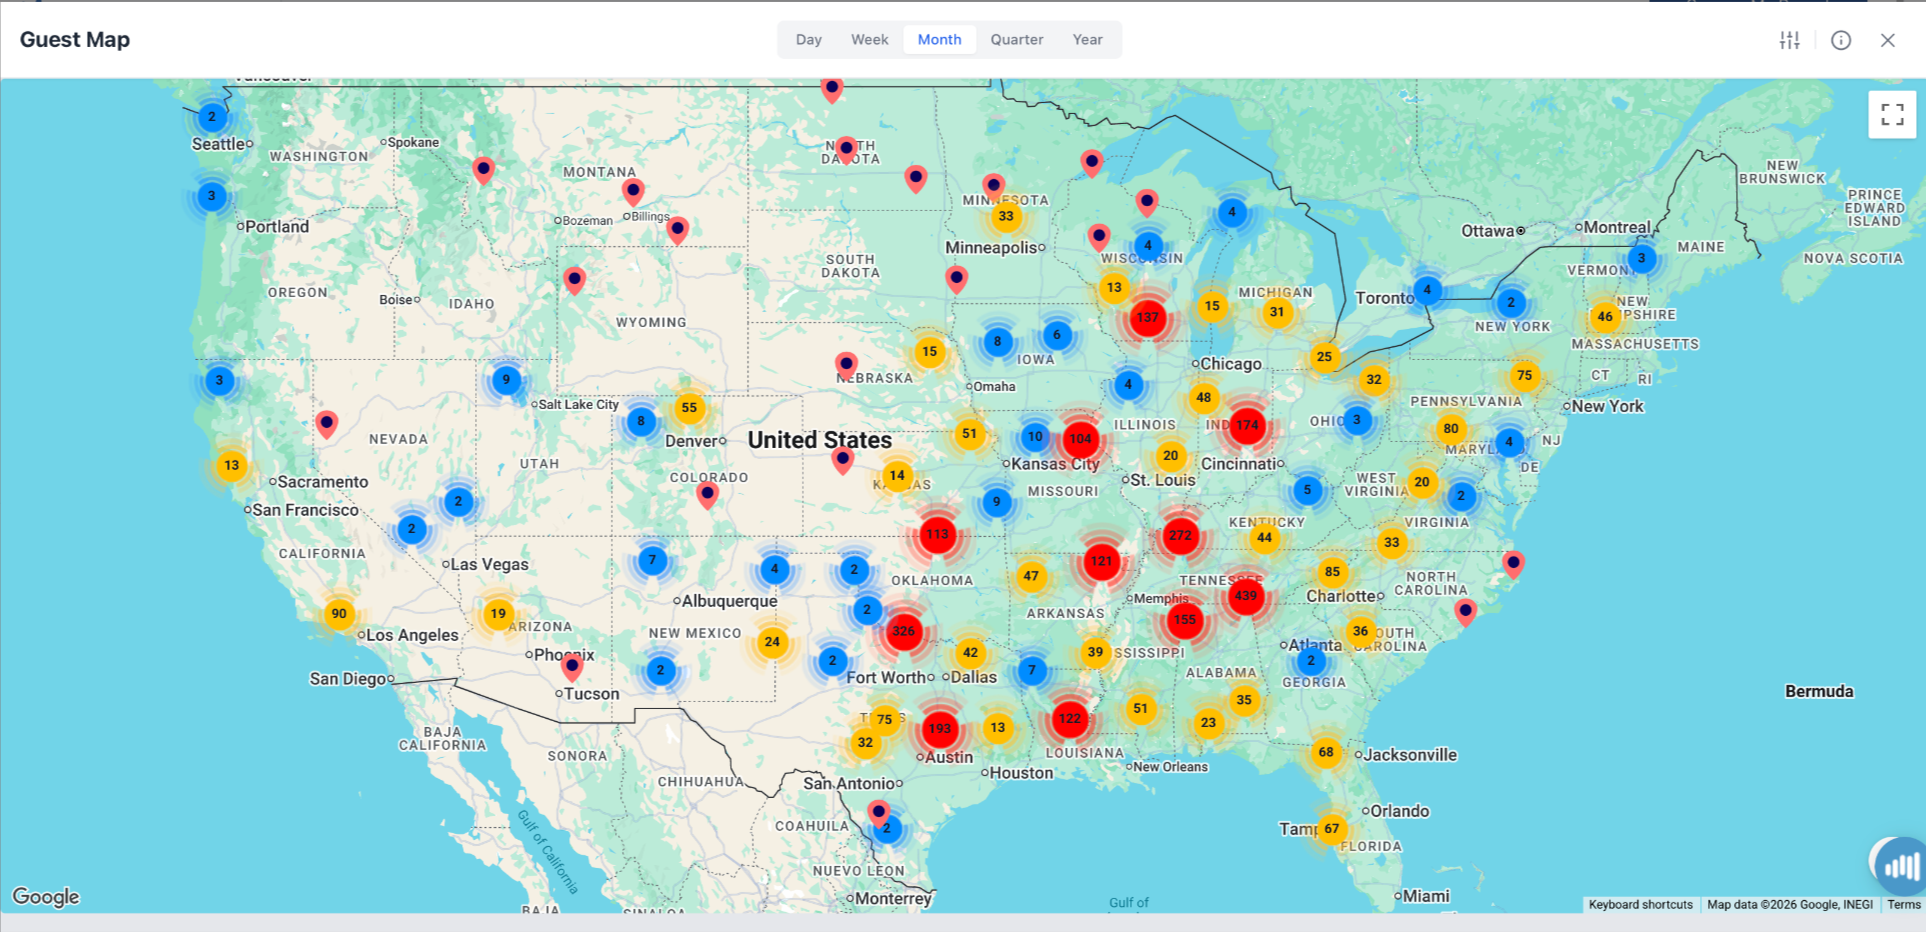
Guest Map: Understand Where Your Audience Lives
Marketing works best when it starts with a clear picture of the audience. The Guest Map provides that perspective by visualizing where travelers are coming from geographically. Instead of scanning tables of cities and states, marketers can quickly identify the regions driving the greatest share of bookings.
You may find demand concentrated within drive markets, suggesting opportunities for short-stay campaigns. Or you may see stronger interest from fly-to markets where messaging around longer vacations and destination experiences is more relevant.
Understanding guest origin helps shape everything from audience targeting to regional partnerships and paid media planning.
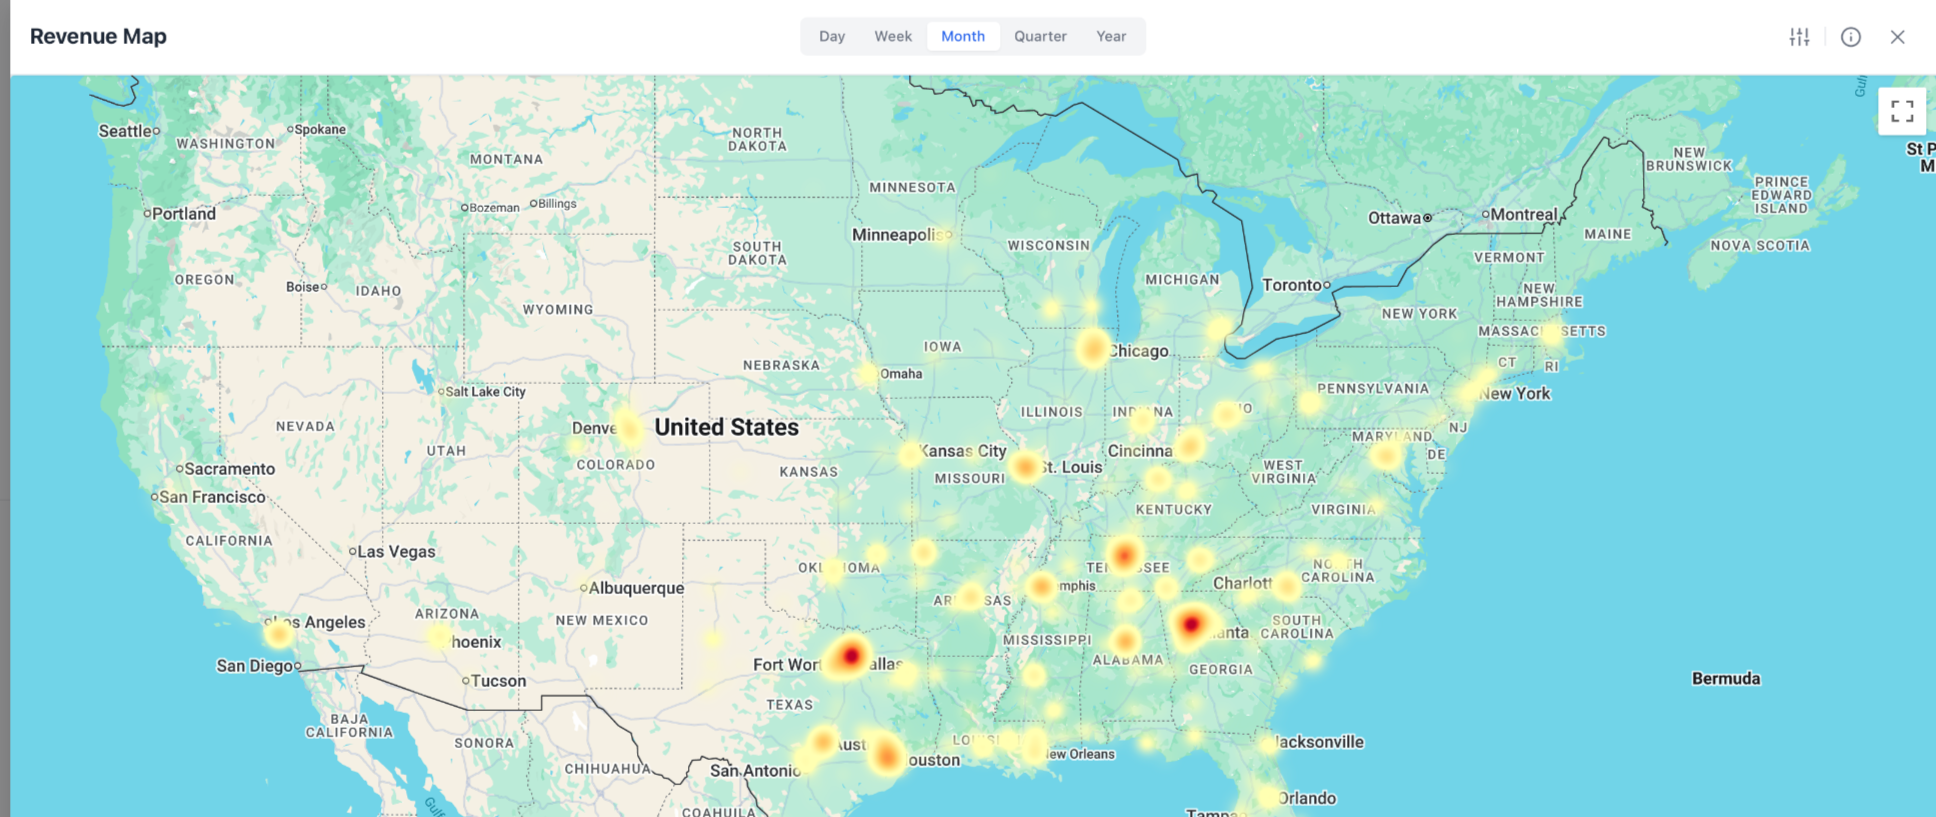
Revenue Map: Don’t Confuse Volume with Value
The markets generating the most bookings aren’t always the markets generating the most revenue. That’s an important distinction when advertising budgets are limited.
The Revenue Map highlights where booking revenue originates, helping marketers identify high-value source markets that may deserve greater attention. A market sending fewer guests but generating significantly higher revenue may justify additional investment, particularly if those travelers book larger homes, stay longer, or travel during premium periods.
Looking at revenue alongside guest volume creates a more balanced view of market opportunity than either metric on its own.
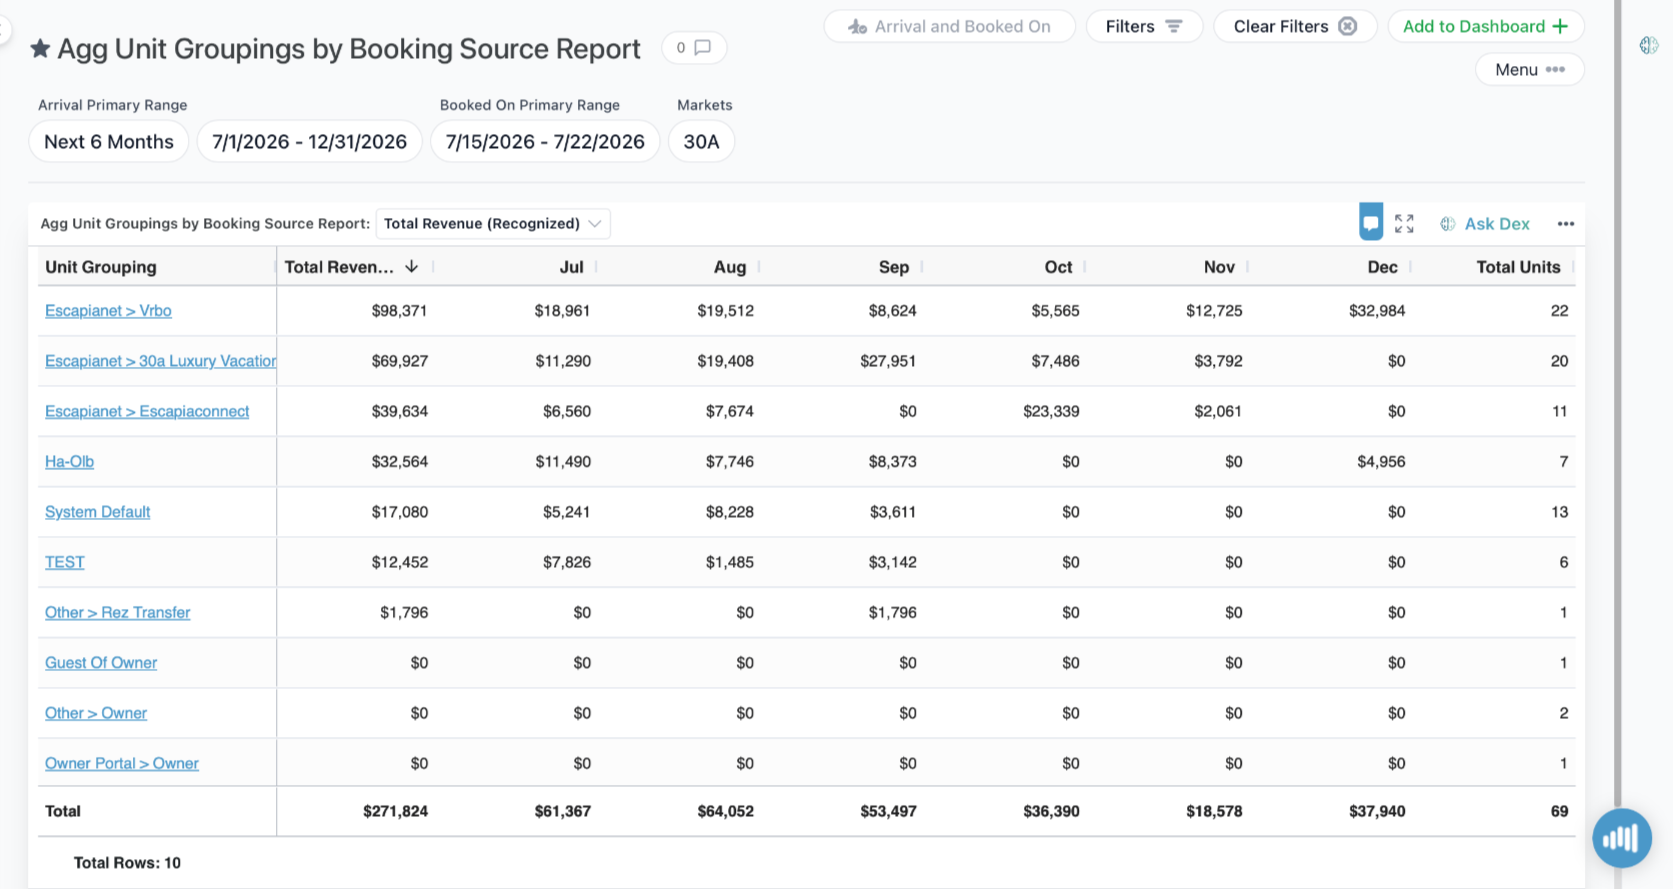
Unit Groupings by Booking Source: Follow the Booking Behavior
Marketing doesn’t end when someone visits your website. It ends when a reservation is made. The Unit Groupings by Booking Source Report shows how bookings are distributed across direct channels and online travel agencies, providing insight into where guests are choosing to complete their reservations.
If direct bookings continue growing, investments in SEO, email marketing, CRM, and branded search may deserve additional focus. If OTA channels remain the primary source of conversions for a particular market or property type, marketing strategies should reflect that reality rather than fight it.
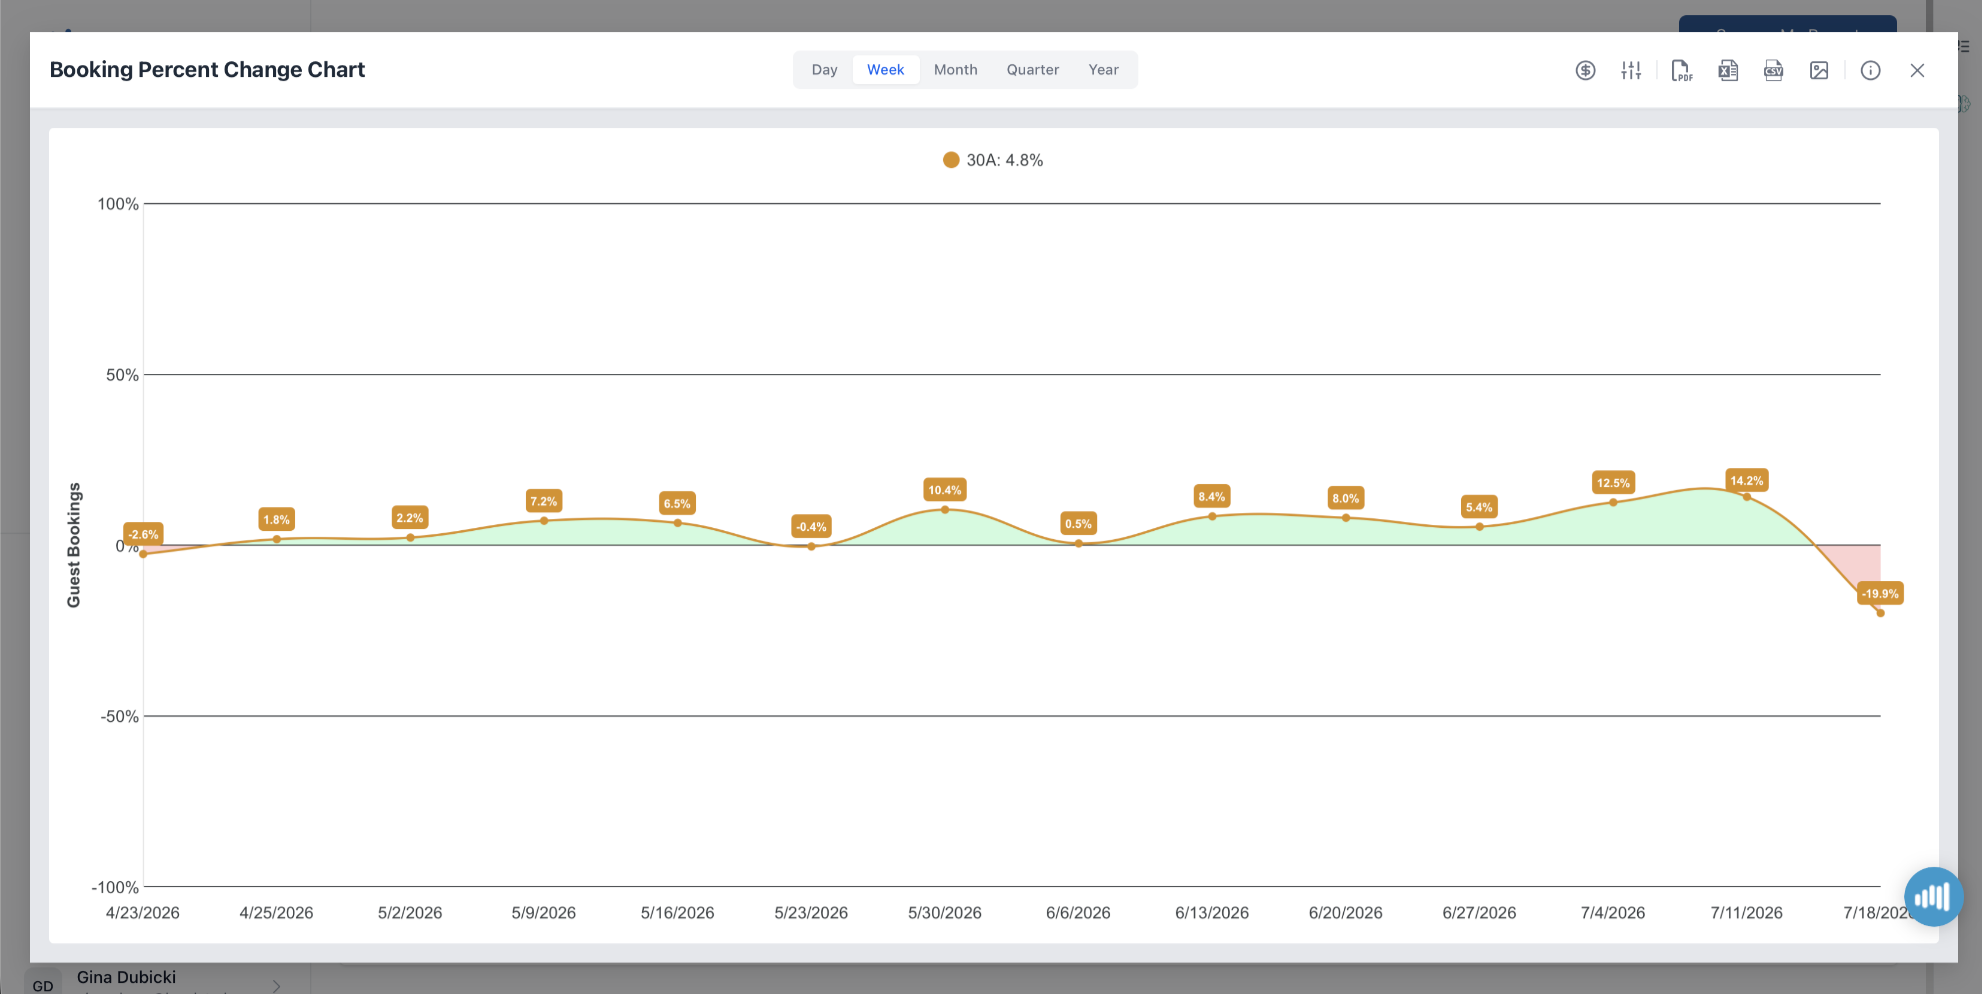
Booking Percent Change Chart: Measure Demand, Not Just Marketing Activity
Impressions, clicks, engagement, and website sessions all have their place, but none of them answer the question every marketer eventually asks:
Did demand actually change?
The Booking Percent Change Chart tracks changes in booking volume over time, providing another perspective on campaign performance. When reviewed alongside feeder market trends and booking source data, it becomes easier to understand whether demand is increasing, leveling off, or slowing across different periods.
Marketing influences demand, but it isn’t the only factor. Economic conditions, weather, events, airline schedules, and traveler confidence all play a role. Looking at booking trends alongside campaign performance helps marketers evaluate results within the broader market context.
Look Beyond Campaign Metrics
Clicks, impressions, and website traffic all have value, but they only tell part of the story. Understanding where guests come from, which markets generate the most revenue, how travelers choose to book, and whether demand is shifting over time gives marketers the context they need to make better decisions.
KeyData’s marketing reports bring those insights together, helping teams move beyond measuring campaign activity and toward understanding the market itself. That leads to smarter targeting, better budget allocation, and campaigns that align with how travelers are actually booking.
Frequently Asked Questions
What is a feeder market in vacation rental marketing?
A feeder market is the geographic area where guests originate before traveling to a destination. Understanding feeder markets helps marketers identify where demand already exists and where future marketing efforts may have the greatest impact.
Why should marketers track guest origin?
Guest origin data helps marketers understand where travelers are coming from, prioritize advertising markets, evaluate regional demand, and identify new opportunities as travel patterns change.
What’s the difference between a Guest Map and a Revenue Map?
The Guest Map shows where bookings originate geographically, while the Revenue Map highlights where booking revenue comes from. Together, they help marketers distinguish between markets generating the highest booking volume and those producing the greatest revenue.
Why is booking source data important?
Booking source data shows where guests complete their reservations, whether through direct channels or online travel agencies. Understanding those patterns helps marketers make more informed decisions about channel investment and acquisition strategy.
How can marketers tell if a campaign influenced demand?
No single report can attribute bookings directly to a campaign, but reviewing booking trends, feeder market changes, and booking source performance together provides valuable context for understanding whether marketing efforts align with changes in traveler demand.
How often should marketing teams review these reports?
Many teams review these reports monthly during campaign planning and quarterly during strategic planning. During peak booking periods or major marketing initiatives, more frequent reviews can help identify changes in demand earlier.
Why should marketers look beyond campaign metrics?
Campaign metrics measure marketing activity. Market reports provide context around traveler behavior, geographic demand, and booking patterns. Looking at both together creates a more complete picture of marketing performance.





