.png)


Key Takeaways:
- Occupancy forecasting estimates the final occupancy rate a property or a portfolio is likely to reach for a future stay period rather than relying on reservations currently on the books.
- Pacing curves, historical pickup, and lead time data work together to show how bookings are accumulating and how much demand may still arrive.
- A 90-day forecast combines current occupancy with projected pickup and market benchmarks to identify whether softness is isolated to the property, portfolio-wide, or market-driven.
Looking at occupancy 90 days before arrival only tells you how many nights are currently booked, not where the month is likely to finish. Occupancy forecasting estimates how much additional demand is still expected before check-in, giving operators a much clearer picture of future performance.
Current on-the-books occupancy counts reservations already confirmed for a future stay period. Forecast occupancy estimates the final result after expected pickup, giving operators better information for pricing, marketing, staffing, and owner communication.
Booking timing can materially change how a future month looks at any single point in the reservation cycle. The 4th of July 2026 STR Performance Report found that travelers across 25 U.S. markets booked 2.1% earlier for the July 3–6, 2025 holiday window than for the comparable 2025 period, showing why revenue teams should read current occupancy alongside booking-window and pickup trends rather than treat today’s calendar as the final outcome.
In this article, we’ll review how professional STR operators combine pacing curves, historical pickup, lead time, and market benchmarks to build a 90-day occupancy forecast.
What a 90-Day Occupancy Forecast Actually Predicts
Occupancy forecasting predicts the final occupancy rate a property or portfolio is likely to reach for a future stay period. While current-on-the-books occupancy and pacing show where bookings stand today, the forecast estimates the result after the remaining booking window and expected pickup have played out.
For example, consider a four-bedroom property at 38% on-the-books occupancy 60 days before arrival, compared with 46% at the same point last year. That eight-point pacing gap may look concerning, but the property could still reach its target if the current booking window is shorter and similar properties typically add substantial occupancy during the final 60 days.
You can use forecasting to determine whether performance warrants an independent pricing, distribution, or marketing response, or whether demand is simply arriving later.
Your operations team can use projected occupancy to plan staffing and service capacity, and your portfolio teams can use the forecast to identify whether booking gaps are concentrated in certain units or visible across the broader market.
A 90-day horizon is far enough out to adjust campaign timing, stay restrictions, channel availability, and revenue strategy, yet close enough for current booking behavior to provide a meaningful signal.
The Data Professional Operators Use to Forecast Occupancy
Professional operators build an occupancy forecast from three data inputs: pacing curves, historical pickup trends, and lead time data.
Pacing curves
A pacing curve shows how bookings accumulate for a specific stay date as the arrival date approaches. A curve ahead of the same point last year indicates more occupancy is currently on the books; a curve behind indicates fewer reservations have accumulated at the same lead time.
Being ahead, or behind, last year’s pace doesn’t automatically mean you’ll finish ahead or behind. What matters is how much booking activity typically occurs during the remaining lead time.
Your teams must compare equivalent “as of” dates and account for changes in pickup and booking timing before deciding whether a pacing gap requires action.
Historical pickup trends
Historical pickup measures how many reservations or occupancy percentage points a property has typically added during the remaining weeks before a stay date. That history provides a realistic starting point for estimating how much occupancy is still likely to materialize.
For example, a portfolio at 44% occupancy 45 days out may still forecast near 72% if comparable stay periods have historically added 28 occupancy points during the window. Your revenue teams should adjust the starting estimate for seasonality, local events, inventory changes, and current market pickup, rather than simply assuming a repeat of the previous year.
Lead time data
Booking windows rarely stay constant. If guests are booking later than they did last year, a property can look behind at 90 days without actually being in trouble. That’s why lead time should always be interpreted alongside pacing rather than on its own.
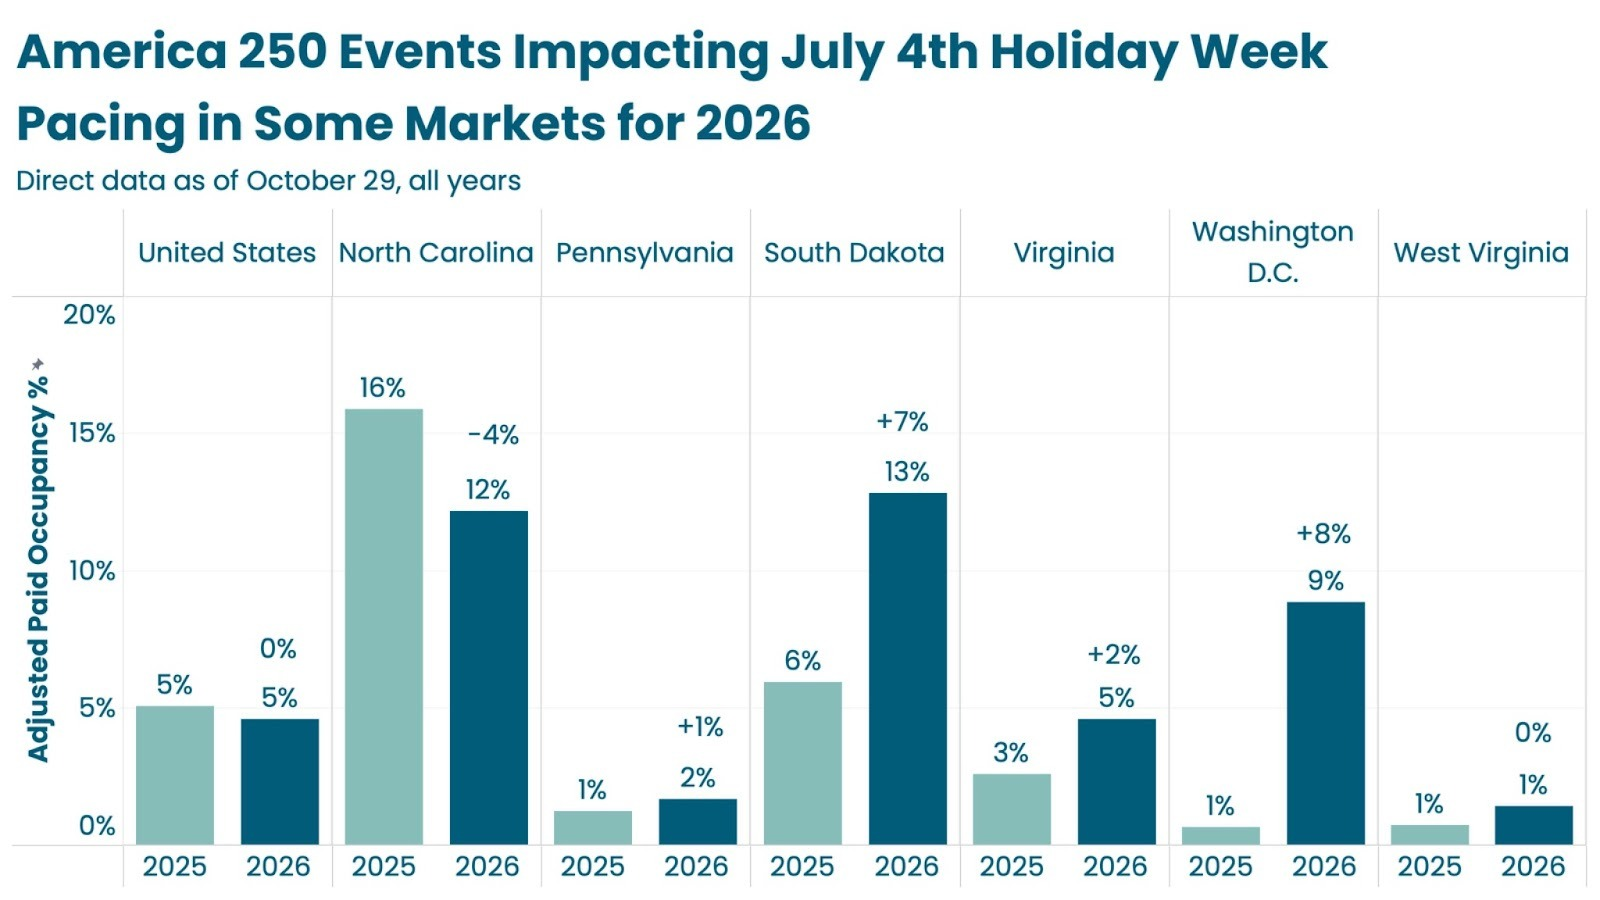
Major events can pull demand much further forward than a typical booking cycle. The America 250 analysis states that as of November 2025, U.S. vacation rentals for the 4th of July, 2026, travel period had an average booking of 331 days nationally and 333 days in Washington, D.C.
While these figures are event-specific, they show why you must interpret pacing against the relevant market, stay dates, and booking behavior.
How to Build an Occupancy Forecast 90 Days Out
An occupancy forecast 90 days out combines current on-the-books occupancy with the pickup expected before arrival, calibrated against historical pacing for a comparable stay period. As a result, a final occupancy rate is projected that your revenue teams can use to compare it with the target, prior-year performance, and the wider market.
The calculation
The simplest calculation formula you can use is:
Current on-the-books occupancy + Projected pickup = Projected final occupancy
- Current on-the-books occupancy is the percentage of available nights already reserved for the selected stay period.
- Projected pickup is the number of additional occupancy percentage points expected between today and the arrival date, based on comparable historical booking patterns.
- Historical pacing provides context for estimating projected pickup by showing how bookings accumulated during comparable stay periods.
For instance, if a portfolio has 42% occupancy on the books at 90 days out and comparable periods have historically added 30 occupancy points before arrival, the initial forecast is 72% final occupancy. However, if the portfolio target is 80%, the eight-point gap gives you the time to investigate rate positioning, stay restrictions, channel availability, listing conversion, and campaign timing.
Projected pickup should be expressed in percentage points, rather than as a percentage increase. Adding 30 occupancy points to 42% produces a 72% forecast, whereas increasing 42% by 30% would produce an incorrect result.
Market benchmarking makes an occupancy forecast more diagnostic. Comparing a property’s pace with similar homes in the same market can help your revenue teams determine whether a projected shortfall is specific to one unit, visible across the portfolio, or part of a broader demand shift.
Turning the Forecast Into Early Action
Occupancy forecasting creates value when you connect the projected results to a specific action while demand is still available. A forecast below target is not an automatic instruction to lower rates; rather, it’s a signal to determine whether the gap comes from market-wide softness, changing booking behavior, or property-level friction.
When your revenue team sees portfolio pace 15 percentage points behind target 75 days out, they can compare recent pickup with historical and market pickup. If comparable properties are gaining bookings while the portfolio is not, your team can review rate positioning, minimum-stay rules, fees, channel availability, and listing conversion. If the wider market is also pacing slowly, an immediate portfolio-wide discount may reduce ADR without resolving the underlying demand issue.
When your marketing and distribution team sees the average booking window shorten, they can move campaigns closer to arrival, review which channels are producing recent pickup, and focus spend on dates that still have recoverable demand.
When your operations team sees forecast occupancy rise ahead of a peak period, they can adjust housekeeping capacity, staffing, and vendor schedules before late bookings create operational pressure.
Your portfolio team can compare individual-unit forecasts with relevant market benchmarks to identify which properties require attention. A unit trailing both its historical pace and comparable properties may warrant a closer review of availability, stay restrictions, amenities, listing quality, or owner-blocked dates before making pricing changes.
Compass Resorts used KeyData to review their pickup reports and traveler search trends two to three times per week, giving them a clear market context before adjusting their pricing and minimum-stay rules. They ultimately outperformed both the local market and their previous-year performance heading into the summer.
Forecast Occupancy Early Enough to Change the Outcome
Occupancy forecasting turns pacing, expected pickup, and lead time into a projected final occupancy 90 days out. The real benefit lies in using the projection early, while your team still has time to address soft demand before it becomes lost revenue.
Request a demo of ProData to see how forward-looking pacing and market benchmarks help you make pricing and portfolio decisions with greater confidence.





